2018 Concept Grant Interview with MiniVan
WHAT IS MINIVAN AND HOW DID YOU START OR COME UP WITH THE IDEA?
For many years, the network of researchers and research centers associated with the Public Data Lab have been working for various reasons and in various contexts with networks and network analysis. The main tool we used for this work, along with thousands of other users is Gephi. Introduced some 10 years ago by Mathieu Jacomy (now one of the lead developers of MiniVAN), Gephi has become amazingly popular, thanks to its capacity to make network analysis accessible to broader publics, by favoring a visual and hands-on approach to explore the narrative and interactive capacities of networks, rather than focusing exclusively on their analytical capacities through complex mathematical metrics.
As a “computer-based” piece of software, however, the final output exported and published from Gephi is a static image. The public can no longer interact with this network: no zooming, panning, filtering, changing colors or positions. What “publishing a network” is, needs to be thought anew, from a theoretical and practical point of view.
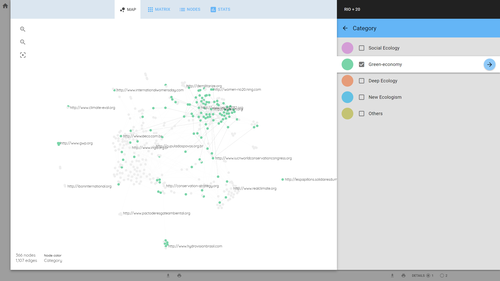
In order to open up this experience of interaction to the public, we decided to move beyond Gephi, shifting from a locally installed software to a web-based approach. MiniVAN is born precisely from the desire to overcome (or at least reduce) the gap between creators and publics of network visualizations. Fully developed in JavaScript, MiniVAN sits in the browser, does not require any installation and allows the public to actively interact with the networks—not just visualize, but actually filter, switch views, move from the chart to the node table, change the position, the color and size of the nodes.
WHAT WERE YOUR MAIN CHALLENGES AND HOW DID YOU OVERCOME THEM?
Moving from a local to a web-based technology raised technical issues around performance. The networks that modern users are used to interacting with span from a few dozen to several thousands of nodes and the software should be able to handle them all without bugs, maintaining a responsiveness sufficient to sustain the experience of acting directly on the network. When, for instance, a spatialization algorithm is launched, the user needs to be able to see the network unfolding in real-time. No existing technology was able to offer such responsiveness and we could only develop MiniVAN by relying on and improving a specialized JavaScript library, Sigma.js, created by Guillaume Plique (another lead developer of MiniVAN).
The second technical challenge—still being solved—is connected to the infrastructuring of network analysis. The V1 of MiniVan has taken a crucial step in the direction of web-based technologies and of eroding the difference between networks’ creators and networks’ publics, but given the little time and resources available it could not complete the transition that it started. MiniVAN offers several core features of network analysis and manipulation, but it does not handle all the ancillary functions connected to working with networks online. This includes the possibility of having a personal space online where draft charts can be stored, completed charts can be published and shared, comments can be added and projects can be forked and so forth. These functions are all important to facilitate the interaction between users and create a community of network investigators. Yet these functions require the creation of a digital infrastructure around the tool and this requires technical and administrative resources which we still do not have access to.
The third challenge is less technical and more related to the design of an interface capable of rendering the vanishing distinction between the creators and the publics of networks. In the first beta version of MiniVAN, we decided to erase this distinction completely: the MiniVAN network analyzer was supposed to serve both the original creators of networks and their audiences without differentiating between them. Beta-testing, however, revealed that this solution had the disadvantage of hindering the embedding of the visualization in a third-party website. This turned out to be a major problem, as embedding still remains the best way to frame the network in a multimedia (con)text facilitating their interpretation and exploration. In the last few months we therefore worked to develop an embed function allowing a user to generate a simplified version of the MiniVAN network analyzer interface that can be shared as an iframe to be added to any web page.
WHAT SETS YOU APART FROM OTHER TOOLS AND SERVICES IN THIS SPACE AND MAKES MINIVAN RESONATE SO WELL WITH SOCIAL SCIENCE RESEARCHERS ?
MiniVAN, as Gephi before it, has a resolutely visual approach. Compared to the standard mathematical graph analysis, Visual Network Analysis (VNA) has three main advantages:
Exploratory approach
First, VNA is simpler and more user-friendly and does not require users to understand the complex computations behind most network metrics. This enables a variety of users to analyze networks, including social scientists, journalists, activists and so forth. More crucially, the ease of VNA encourages an exploratory approach to data analysis, facilitating a playful attitude deriving from interactions with the network.
Not losing the big picture
Second, unlike graph metrics, VNA does not aggregate the information contained in the networks. Each node and edge remains visible and can be singled out by zooming, filtering and selecting. This allows users to focus on every element of the graph, without losing the big picture.
The ambiguity of networks
Thirdly, VNA preserves a part of the ambiguity deep-rooted in the relational occurrences that it allows to explore. A classic example is node communities. While algorithms for clustering detection (e.g. modularity or clique percolation) tend to cut the networks in well-defined and well-separated groups, visual clustering is more ambiguous: it does not show clear-cut boundaries, but suggests areas that are dense or sparse reflecting the vagueness of relational borders.
Not surprisingly, the three characteristics above are of particular interest to the social sciences—especially in the digital social sciences. Scholars in the social sciences tend to work with networks of an intermediate size: too big to be treated manually, but too small to justify the direct passage to aggregation and statistical metrics. Visual Network Analysis and subsequently MiniVAN are adapted to this public. Yet they can also appeal to natural science researchers, data journalists and data activists and generally where the goal of the research is to explore relational phenomena (rather than to confirm some predefined hypotheses).
DO YOU HAVE ANY INTERESTING EXAMPLES OR CASE STUDIES TO SHARE?
We’ve explored the use of workshops as a research method a few times. Seven years ago at our first workshop of the EMAPS project (led by Bruno Latour), we developed the protocol into a format for working with data and using digital tools as prompts for the collective investigation of social and political issues (in the case of EMAPS: the adaptation of climate change). With the MiniVAN workshop, we tried to prompt the attendees to think about the applicability of network analysis, and what comes after the network is visualized.
Networks and their Publics: A Public Data Workshop for the MiniVAN Project
We organised a workshop in November 2018 with a few experts who routinely use networks to produce knowledge: journalists, teachers and researchers (including Daniela Duca, Product Manager from the SAGE Ocean team). The workshop’s protocol aimed at the convergence of practice-centric and tool-centric approaches to network visualization. We first asked the participants to describe their network practices around three focal points (network creation, visual inquiry, and network publication). Then, after presenting MiniVAN we asked the participants whether they would use this new tool, or the conditions under which they might use it. It turned out visual inquiry is one particular way by which practitioners explore relational data. Journalists, in particular, use networks to query items, detect problematic relations or understand the role of particularly central nodes without the need for visualization, including in the publication phase where the “story” remains the standard unit. However, it was also noticed how visualizations enable mediation between expertise across disciplines; how much value would be added to be able to share particular network views; or how it would be important to document the process behind the outcome. These three forms of publication are among those MiniVAN aims to address. It was also acknowledged that no ready-to-use tool exists specifically to do this.
The development of MiniVAN as a research endeavor is a great opportunity to actually address the need for better descriptions of network practices in their context, or situated network practices.
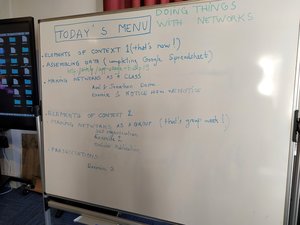
Doing things with networks
In March 2019 Jonathan Gray and Axel Meunier prepared and conducted a workshop with King’s college students entitled “Doing things with networks” in reference to J. L. Austin’s classic on the performativity of language and its reception in science and technology studies in relation to the performativity of, for example, numbers, graphs and models. The workshop focused not only on learning how to visualize networks through getting familiar with Gephi and MiniVAN, but also on learning about how to represent and publicize issues through simple exercises to explore, document and materialize networks. In this context, MiniVAN was used as a very simple way to share visualizations among a group of students, and then to present them in front of a live audience, effectively fulfilling the role of MiniVAN as a network publication tool.
Beta testing workshop
The above mentioned workshop also enabled us to beta test MiniVAN. The tool will be further beta tested in an upcoming workshop co-organised by the médialab of Sciences Po and the master NUMI of the university of Paris Est. During this workshop the students and a group of scholars from several Parisian research institutions will use MiniVAN to explore a series of YouTube networks related to the French vlogosphere and the political debate about the European election. MiniVAN will also be used to produce and circulate their results. This work will inform a last round of modifications and improvements before the final launch.

HOW DID YOU HEAR ABOUT THE SAGE CONCEPT GRANTS, WHAT MADE YOU APPLY AND HOW THE FUNDING HELPED YOU BRING YOUR IDEA CLOSER TO A FULLY OPERATIONAL TOOL THAT RESEARCHERS CAN USE?
We discovered the SAGE Concept Grant through the mailing-list of the Association of Internet Researchers and through the contact that the Public Data Lab has had with SAGE (who sponsored the setting up of this transnational research network).
The concept grant is a really interesting and original type of funding. On the one hand, the funding available to the development of tools outside academia does not always fit the conditions and needs of research environments. Funding for the development of software is often targeted at industry, placing great importance on the stability and scalability of solutions, and is generally wary of the agile and experimental endeavors typical of academic research. On the other hand, while there are funding opportunities in academia, they tend to support intellectual exchanges and collaborative research, and very rarely the development of research tools. When this kind of funding is available, it is generally targeted to the natural sciences and covers the cost of setting up big infrastructures and equipments.
Light, short, medium-scale calls for projects supporting the development of experimental and research-oriented tools for the social sciences are extremely rare and SAGE Concept Grant is one of the most interesting for its direct connection with the community of digital social sciences.
WHAT’S YOUR TAKE ON THE FUTURE OF TOOLS FOR SOCIAL SCIENCE RESEARCHERS?
“The promise of digital methods should not be to increase the quantity of data available, but rather to increase the number of researchers and publics being able to access and use this new type of information.
The increase in tracking of social phenomena due to the growing capacity of digital media to record interactions that they mediate brings great promise but also some risks. In particular,an excessive focus on collecting larger quantities of digital data (according to the ‘big data’ gospel) may entrench the existing divide between quantitative and qualitative. In this scenario, the exploitation of the data captured through digital technologies and online platforms will be limited to researchers equipped with the skills and infrastructure necessary to handle them, while most researchers in the social sciences will keep working with traditional qualitative methodologies.
The Public Data Lab does its best to counter this outcome. The promise of digital methods should not be to increase the quantity of data available, but rather to increase the number of researchers and publics being able to access and use this new type of information. This is why we believe that the new generation of tools for the social sciences should be judged for their openness, user-friendliness and adaptability rather than for their sheer computational power. This means that tool development cannot be left to computer scientists and code developers, but needs to mobilize designers, social scientists and social actors.
Building on the work of many researchers associated with the Public Data Lab, “natively digital” data from the web and online platforms—whether from APIs, scraping, or otherwise—presents opportunities for not only utilizing the default “built in” metrics and methods (such as the “vanity metrics” of online platforms), but also for rendering these amenable for critique and other alternative digital research practices, including “critical analytics” and “inventive methods”. This will become increasingly important as we see the rise of controversies associated with emerging technologies, as well as questions raised about the role of algorithms in social, cultural, political and economic life (which is something we’re actively working on at the moment).
WHERE CAN RESEARCHERS FIND YOUR TOOL AND CAN THEY USE IT ALREADY?
All the tools we will produce will be accessible through The Public Data Lab website. A wide variety of tools can be found on the websites of research centers associated with the Public Data Lab including the médialab at Sciences Po and the Digital Methods Initiative at the University of Amsterdam.
WHAT ARE YOUR NEXT STEPS AND HOW CAN OUR READERS GET INVOLVED?
A possible direction is the format of the MiniVAN network bundle. Initially thought of as instrumental to the use of MiniVAN (it enables the user to store their edited files and publish them in the visualizer), it turns out there is an interest to develop the format into a new network data package. MiniVAN could be the default visualizer but we can imagine further developments outside our own tools
The project also enabled us to ask questions around the role of tool development for social science research. Drawing on this, we have started a research project on situated network practices to accompany the development of MiniVAN.
We draw on previous research exploring the analytical and interactive capacities of networks (about which you can find an interesting discussion in the recent Digital Sociology book from Noortje Marres, who is also a member of the Public Data Lab). We are also keen to advance the understanding of networks not just as technical objects but as socio-technical accomplishments, including the different actors, devices, cultures and situations which are involved in making sense of them—we want to look beyond established and conventional practices. In previous work we studied the narrative capacities of networks in the context of journalism. We’d like to further explore how campaigners, investigators, online subcultures and others make sense of networks, including “everyday” engagements with network visualizations. In doing so we will also investigate how network practices deviate from expected uses in more established settings. Rather than looking to correct or normalize these alternative practices, we’d also like to see how one can infer established practices (just as “pseudo-science” tells us something about established scientific norms), and other possible avenues for making sense with networks in society.
This project is designed as a participatory research project that aims to mobilize a community of network practitioners and attempts to reframe the development of MiniVAN within the “network practices” narrative. The development of the tool, and our approach given our social science practice, had some unexpected outcomes and positive spillovers beyond the initial scope of what we set out to accomplish.