Social Scientists Connect with LinkedIn Data
Back in 2012, when LinkedIn was close to the 200 million users mark, a young but very computational (and quite resourceful) assistant professor, hustled through his contacts and somehow managed to get access to the trove of LinkedIn data. Prasanna Tambe—at the NYU Stern School of Business at the time—was not the first to use the information on LinkedIn for research, but definitely the first to use LinkedIn data to this scale. Tambe mined the skills and roles of all 175 million users at the time, though he probably ended up working with a smaller sample, to understand how the rapid evolution of skills and know-how in the technology sector is impacting investments in new IT innovations.
Today, researchers are using LinkedIn data in a variety of ways: to find and recruit participants for research and experiments (Using Facebook and LinkedIn to Recruit Nurses for an Online Survey), to analyze how the features of this network affect people’s behavior and identity or how data is used for hiring and recruiting purposes, or most often to enrich other data sources with publicly available information from selected LinkedIn profiles (Examining the Career Trajectories of Nonprofit Executive Leaders, The Tech Industry Meets Presidential Politics: Explaining the Democratic Party’s Technological Advantage in Electoral Campaigning).
Most of these uses involve manual lookups and graduate students spending days to sift through the site, copy pasting the information into a spreadsheet. A LinkedIn API is available for larger scale datasets, but there are limitations—such as no more than 100,000 lifetime users, no storing of content, and it cannot be used for research purposes. If you had a large enough network, you could also download your network’s data and work with that CSV output. Essentially, you need some computational skills to collect and use the LinkedIn data, and you would still be limited in the type of research you could do. Gian Marco Campagnolo, a Turing Fellow and lecturer at the University of Edinburgh used some LinkedIn data for his team’s research into the career evolution of IT professionals, but they still needed to get a list of names from another database.
Enter the Economic Graph Challenge
With over 630 million users with 35,000 skills, 30 million companies and 20 million advertised jobs, researchers could explore an extensive set for labor market research. LinkedIn acknowledged the power in this data and decided to make use of it, while still protecting their members’ privacy. They launched a project called the ‘economic graph’ to map out the world’s economy. Aware of the benefits of working with researchers (remember Tambe), LinkedIn opened up their data to the academic community, but in a cautious way through the Economic Graph Challenge and later the Research Program. After more than 200 applications, in 2017, LinkedIn selected 11 teams to work with for a year. The second round of applications closed in December 2018.
The Economic Graph Research Program enabled researchers like Laura Gee, from Tufts University, and Jessica Jeffers from the University of Chicago, to use LinkedIn data and explore questions around the attractiveness of job postings for men vs women, or the impact of non-compete agreements and whether they hurt businesses. An intriguing research project coming from Indiana University (that LinkedIn is still working with) designed an algorithm to identify “fine-grained geo-industrial clusters called “microindustries” (e.g., electric vehicle manufacturers in northern California, or Milanese fashion houses) based on workers’ firm-to-firm transitions,” something that could be quite useful for policy-makers.
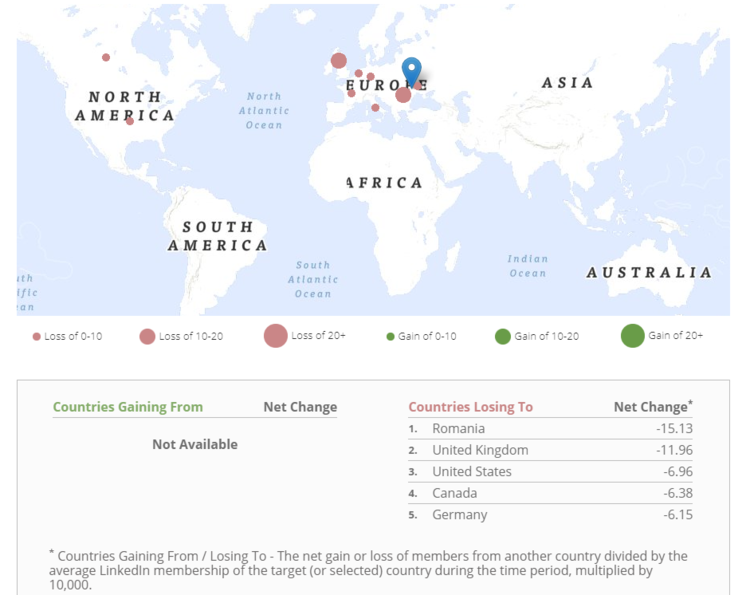
The LinkedIn Economic Graph team continues to work with the data independently of academics, forming partnerships with organisations such as The World Bank Group. I was recently looking at the data made available (to the public through this collaboration) to explore the migration patterns of highly trained people from my home country. I was surprised to find that UK is now number two — after Romania. As the website states, in this first Digital Data for Development collaboration, the two organizations opened up an anonymized and aggregated dataset on “100+ countries with at least 100,000 LinkedIn members each, distributed across 148 industries and 50,000 skills categories.”
Even more interestingly, the LinkedIn Economic Graph is supplementing and reporting on major labor market statistics with their monthly and quarterly workforce reports for countries like the US, UK and India. In the UK the report is timed with the trends reported by the ONS, and in the UK these reports go into more detail than any other administrative dataset. Browsing their site, you can find fascinating analysis into different population groups, like women breaking the glass ceiling faster but in smaller numbers.
While the effort that the LinkedIn group is making is laudable: the data they are sharing at the macro level is helping governments and policy makers across the world, and they are opening it up to a small group of academics; there is still a gap that is quite hard to fill. The data remains proprietary and there is little incentive and too much risk in spending time reviewing every single application from academics around the world that have a genuine interest in working with data that contains enormous amounts of detail about people’s expertise and career timelines, sometimes even more accurately than how they represent themselves in CVs. Tambe was both resourceful and lucky. Today, you have to be even more resourceful and creative.
FURTHER RESOURCES*
- Kaggle dataset of anonymized LinkedIn profiles
- Data.world LinkedIn dataset of top skills by year
- Data.world LinkedIn dataset on job data by US state
- A 2015 list of links to datasets of LinkedIn profiles on Reddit
- Network repository LinkedIn dataset
- The World Bank LinkedIn dataset
- Harvested LinkedIn search data with recipe from getdata.io
- Explore LinkedIn membership by field of study and geography, 2017
- Statista’s LinkedIn user volume dataset
*Scraping web pages and using the LinkedIn API for research purposes violates LinkedIn’s terms and conditions.