
Comparing COVID Deaths and Political Persuasion in the US
How were partisan strongholds across the U.S. impacted by COVID-19? In “The Changing Political Geography of COVID-19 Over the Last Two Years,” the Pew Research Center’s Bradley Jones writes that “as the relationship between population density and coronavirus death rates has changed over the course of the pandemic, so too has the relationship between counties’ voting patterns and their death rates from COVID-19.” He used geographical mortality data on COVID-19 from The New York Times’ through February 28, 2022, to understand how and when different waves of the pandemic spread throughout the US, and population data for U.S. counties from the Census Bureau’s 2015-2019 American Community Survey.
The first wave of the pandemic, from March to June 2020, resulted in the first 125,000 deaths, primarily around the New York City area. These were deaths in areas considered Democratic strongholds. The second wave during the summer of 2020, where 80,000 people died, was mostly in the southern areas of the country.
The third wave in the fall of 2020 and early 2021 was the deadliest period of the pandemic so far, where more than 370,000 Americans died of COVID-19 between October 2020 and April 2021. For these months, the deaths were not concentrated in one area of the U.S, but counties that voted to re-elect Donald Trump as president were suffering significantly more deaths. During this wave, the death rate among Americans living in the counties that supported Trump by the highest margins in 2020 was about 170 percent of the death rate among those living in counties that supported Biden by the largest margins.
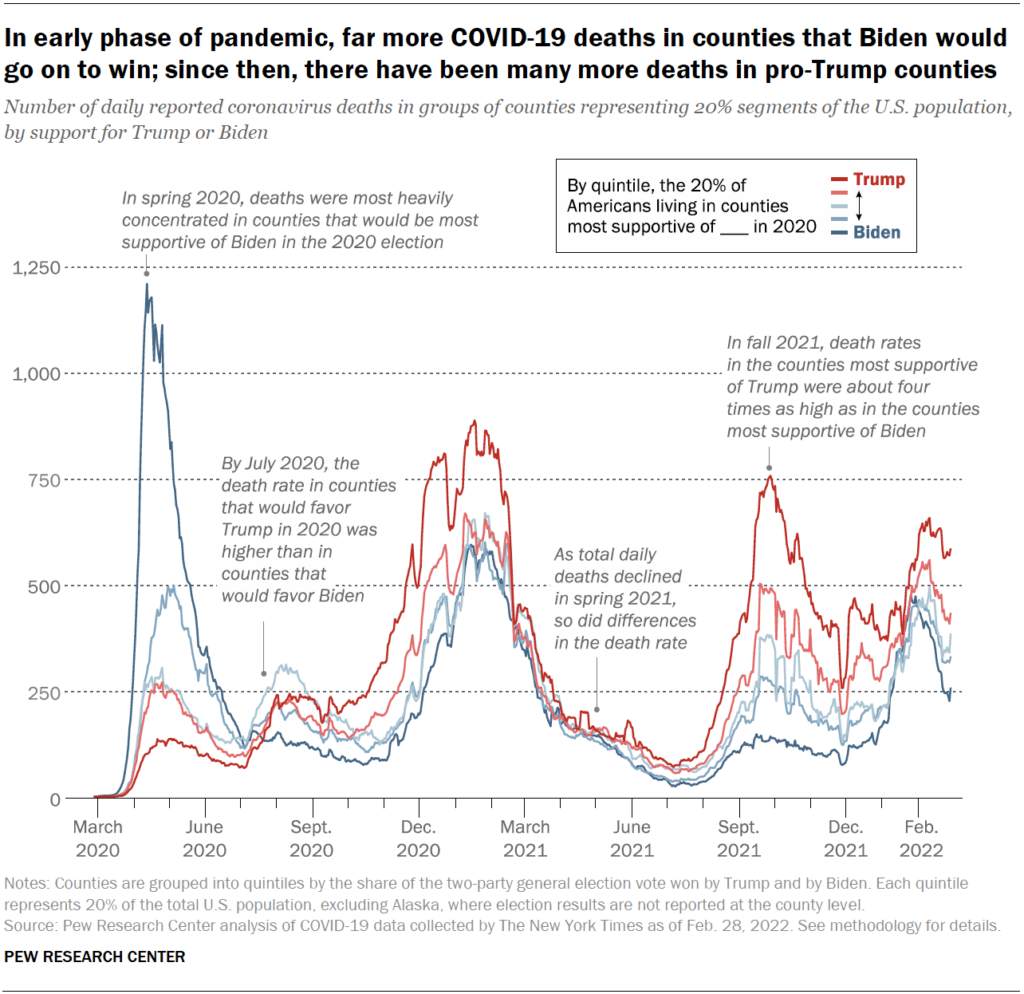
Once the spring and summer of 2021, the overall death rate in the US slowed significantly. Vaccines became available for healthy adults in the spring. “As vaccines became more widely available, this discrepancy between ‘blue’ and ‘red’ counties became even larger as the virulent delta strain of the pandemic spread across the country during the summer and fall of 2021, even as the total number of deaths fell somewhat from its third wave peak,” writes Jones. (He also notes that the picture this county-level data paints may not be fully accurate, since data in many places was lacking or not up to date.)
By the end of the summer, the fourth and fifth waves (marked by the delta and then omicron variants) came in quick succession and claimed more than 300,000 lives. Jones found that the death rates during the fourth wave “in the most pro-Trump counties were about four times what they were in the most pro-Biden counties.” During the fall of 2021, counties with lower vaccination rates were about six times as high as death rates in counties where 70 percent or more of the adult population was vaccinated.
When the omicron variant began to spread at the end of 2021, the death rate for these partisan groups narrowed, though reported deaths in Trump-supporting counties were still about 180 percent of what they were in the most pro-Biden counties in late 2021 and early 2022. Jones found that “overall, the COVID-19 death rate in all counties Trump won in 2020 is substantially higher than it is in counties Biden won (as of the end of February 2022, 326 per 100,000 in Trump counties and 258 per 100,000 in Biden counties).”
As the U.S. Congress debates an additional $10-15 billion for COVID testing and treatment to address the ongoing threat of additional variants, understanding these waves and how partisan divides affect them is crucial for future implications of public health policies.


As the old saying goes… “correlation does not equal causation”. I’d take a wild stab that the average age of Trump supporters is higher than those of Biden and that the Trump group also have a higher proportion on the 70+ age group. I’d also take a guess that the Trump supporters include more people from the working class and non working segments of the population and these groups are well known to have poorer overall health than those in the middle classes who typically sit further left on the political divide. My suspicion would be that Covid cares far… Read more »