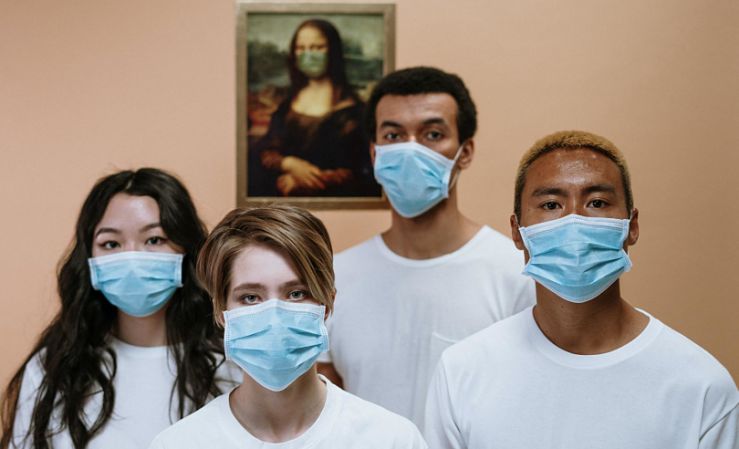
Data Model Confirms That Wearing Masks Saves Lives
Dr. Biplav Srivastava, professor of computer science at the University of South Carolina, and his team have developed a data-driven tool that helps demonstrate the effect of wearing masks on COVID-19 cases and deaths. His model utilizes a variety of data sources to create alternate scenarios that can tell us “What could have happened?” if a county in the U.S. had a higher or lower rate of mask adherence. In this interview, he explains how the model works, its limitations and what conclusions we can draw from it.
What does this computer model do?
This is a nationwide tool which can show the effect that wearing masks can have. If it’s a county where people wear masks regularly, it will show you how many COVID-19 cases and deaths they avoided. If you pick a county where people don’t wear masks, it will show you how many cases and deaths could have been prevented there.
How does it do it?
We need a lot of data to do this. The New York Times surveyed almost every county in the U.S. over the summer and assigned a mask-wearing score of 0-5 to each of them, so this is at the heart of the model. We also use New York Times and Johns Hopkins data for real-time case numbers; census data for demographics such as population size, median age and more; and geographic data to measure the distance between counties.
It is based on a mathematical technique called robust synthetic control, which is often used in drug research, where there is a control group and there is a treatment group.
For example, let’s look at Wyandotte County, Kansas. It has a relatively high mask-wearing score of about 3.4. Because the model is designed to tell us the “what if?” scenario, it will look at what would have happened if the mask-wearing score was reduced to 3.0, which is our cutoff for “low mask-wearing,” but the user can experiment with other values too just to see what happens. We arrived at 3.0 based on analysis of nationwide mask-wearing habits. The actual values ranged between 1.4 and 3.85, with a national average of 2.98.
We can set a date at which the mask-wearing score changes to 3.0. If we set it to run from June 1 to Oct 1, it tells us that Wyandotte County would have had 101.5 percent more cases and 150 more deaths in that period. It tells the user how many deaths have occurred or been prevented based on a mortality rate parameter that the user can set. In this example, it was set at 2 percent.
How does the model create the “what if?” scenario if it didn’t actually happen? It does this by looking at other counties that are close by and have similar demographics and case count but a lower mask-wearing threshold. It tries to come up with a weighted average to form a synthetic control group which is similar to our county of interest (treatment group). The model then looks at how much the two groups have diverged in terms of the case counts. The difference in case counts between the two groups is converted to a difference in deaths using the mortality rate parameter.
What does this tell us about the impact of mask-wearing policies?
Keeping up mask-wearing or implementing a mask policy at any time can be helpful. But its impact is highest when you do it early. When you run this model multiple times using different dates, you see that the impact reduces as you delay implementing a mask-wearing policy. So if a county implemented a mask policy on June 1, it would have prevented many cases. If it acted on July 1, it would have a smaller impact. If it acted in August, it would still have prevented cases, but a very small number.
What are the limitations of this model?
This tool works better for some counties than others. In general, it works best with counties that are closer to the average, because it will have closer matches to compare against. There is also a limitation in the sense that The New York Times mask adherence survey was done in the summer, and things keep changing. So if other researchers use this tool, they will have to account for the changes.
But what you see is that when you implement a mask policy or the population regularly wears masks, it makes a positive impact. And the earlier you do it, the more effective it is.
I would like to acknowledge the work of my team, Sparsh Johri, Kartikaya Srivastava, Chinmayi Appajigowda and Lokesh Johri, in developing this program.